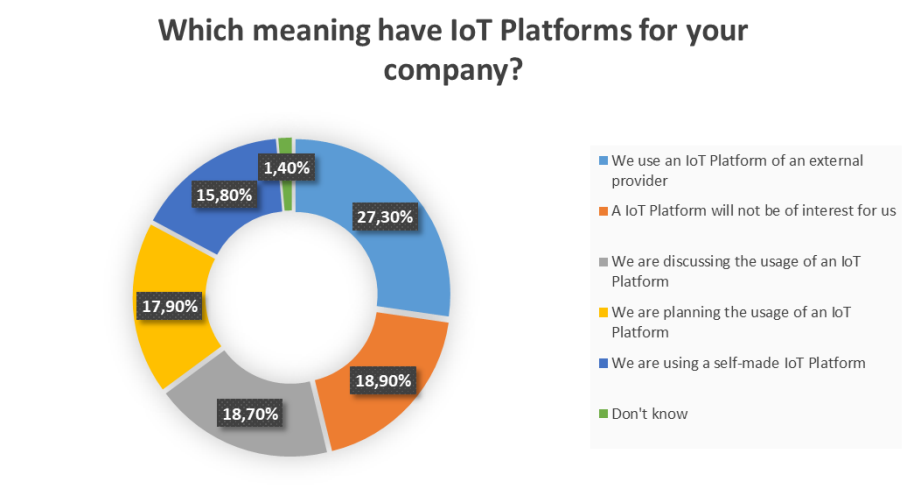
Based on the requirements, test setups and implementations and further resources, we create an evaluation on the middleware aspects of the observed IIoT systems.
| Topic Fields | |
| Published | 2019 |
| Involved Institutes | |
| Project Type | ICNAP Community Study |
| Result Type | |
| Responsibles |
This study focuses on the middleware aspects as defined before, the tasks defined by the partners in context of the software components and the core components of the systems if applicable. As the focus is specific and does not cover the whole functionality of the platforms and does not include real production scenarios at larger scales, the comparison results hold for this focus and specification and do not necessarily hold for other setups or requirements by users and companies.
Contact us to get in touch! With a membership, you’ll gain full access to all project information and updates.
© Fraunhofer 2026